
Introduction
| Process Mapping and Process Flow Charting are techniques that
can be employed to not only provide a visual representation of a procedure but
also have the potential to identify significant savings in the way in which the
process is organised and performed. This is particularly so when aligned
with Process Cost Modelling.
Organisations are full of processes, not only manufacturing processes but processes for purchasing, warehousing, handling orders etc. These processes can involve moving and manipulating data and information (service industries) as much as material (manufacturing industries). They can also involve various departments and specialists in completing tasks and activities, making decisions, filling out forms, filing and retrieving information. The processes can also involve complex parallel and serial activities interconnected and dependant on tasks being completed satisfactorily. Very often these processes have evolved as the organisation has grown, sometimes keeping pace, sometimes overwhelmed by the sheer size of the organisational growth. To solve growth problems - such as maintaining the throughput, quick fix solutions may be used e.g. increasing the labour resource rather than improving or overhauling the process. Sometimes this can just make the situation worse. (If it takes one man one day to dig a hole - then one hundred men can dig the hole in one hundredth of the time - Oh I wish!). |
 Swimlane or Cross Functional |
 Value Stream Map |
| In
other words increasing the labour resource again will not necessarily result in
quicker throughput. Some jobs just cannot be done by more than one person. Not
only can processes be very complex and involved but they can also be very
inefficient; responsibility ownership can be unclear. This is because it can be
very difficult to understand, control and manage all the tasks involved in a
process from start to finish.
Another aspect of process mapping is Value Stream Mapping which is one of the Lean techniques used to analyse the flow of materials and information currently required to bring a product or service to a customer. The technique originated in Toyota, where it is known as "Material and Information Flow Mapping" Training CoursesOther Information Sources:
|
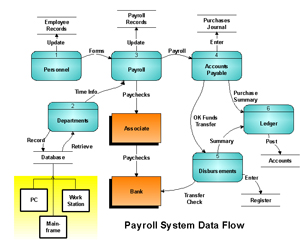 Flowchart |
 Value Stream Map |
Process Mapping Support
|
||
|
Our experienced and knowledgeable staff have frequently been requested to carry out process mapping exercises, which have resulted in very significant saving for the organisation involved. This particularly so when associated and combined with Process Cost Modelling. Also QM&T's unique Post Course Assignment approach has yielded huge saving for organisations - Post Course Assignment & Support: Following the course the delegates are encouraged to complete an Process Mapping work based assignment. Successful completion of this assignment is necessary for the delegates to receive their QM&T Process Mapping practitioner certificate. Throughout this period (typically one month) support is provided from a QM&T recognised Process Mapping professional. Case study material available on request. For further information about Process Mapping and Process Cost Modelling please follow contact details below. |
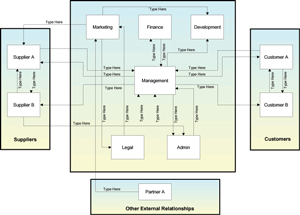 Interrelationship |
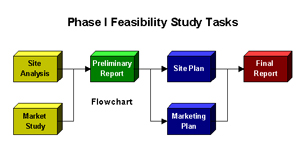 Flowchart |
For further information
If you would like to know more about Process Mapping please contact Sales at:
| Telephone: | + 44 -0 1483 453511 |
| Fax: | + 44 -0 1483 453512 |
|
Postal address: |
Quality Management & Training Limited PO Box 172, Guildford, Surrey, GU2 7FN United Kingdom |
| Electronic mail |
Technical Support:
help@qmt.co.uk Customer Support: tutor@qmt.co.uk |
Links
andy scott